How I Found Out That Picking Losers is the Best Whale Killer

I am sure that some people get tired of me going on about the whales. If so, just ignore this post.
I study them because they're our major competition; the single thing that makes this game most difficult to beat.
Well, in truth, I study the IMPACT of whales.
The battle has been very one-sided. That is, every year the game gets tougher, as the efficiency in the factors becomes more even.
This post will illustrate how I came to this conclusion. Before we are finished, I will also tell you why I think this can actually work in our favor.
I have drawn races from Feb. 01 to July 15th from each of the last 2 years. 5f to 9f, fast tracks, 5+ betting interests, no FTS, and races with entries have been removed.
An example:

Let me tell you what you are looking at.
(This factor is Jim Cramer's Projected Speed Rating. It is very much like BRIS Prime Power.)
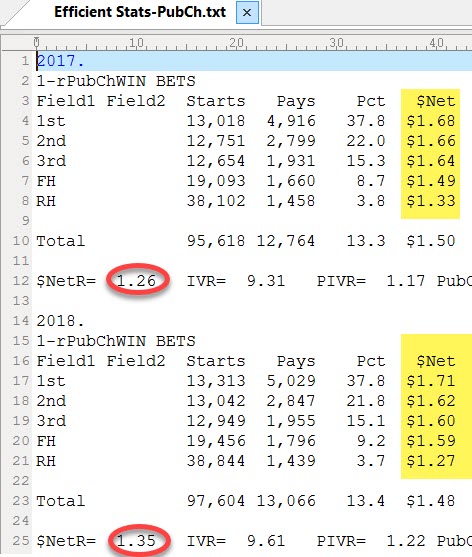
#1. We are concentrating on the $Net column. This is the return per $2 wager for the different ranks. (FH is actually half-the-field-plus-1 horse and does not include 1-2-3.)
#2. See how the $Nets flow downward? This is indicative of how aware the public is of this factor.
In the case of a high-level factor such as PSR or BPP, it actually means that the public is dialed into the factors that make up these "factors." (In our software, we call these "Objects.")
#3. What we are really interested in is the ratio between the top rank and the bottom rank. We call that the "$Net Ratio."
The higher the $Net Ratio is, the more difficult it is to make money with longshots because the bigger prices are going to come from the Rear Half (RH) of the field.
In other words, the better the public is at isolating on the "hot horses," the more they will be bet down. This will effectively take some of those RH horses and cause the winners to no longer be long-priced.
#4. What we want to do at #4 is compare the 2017 $Net Ratio with the 2018 ratio.
What we see in this illustration is that the PSR factor has become more efficient. That is, the ratio has "flattened."
BTW, look at just how bad a "rear-half" horse really is.
Also, note how there is a distinct flattening of the top 3. My belief is that this is indicative of (at least philosophically) the whales doing a better job of finding "true value" in those top 3 ranks.
As they get closer to the same $Net, they have been effectively rendered useless because they make no difference in the bottom line.
Let's look at another example.

Here we are looking at a factor in our system known as "Composite Final Time." It is created from 13 different ways of looking at speed ratings, such as Last Race, Best-of-Last-2-Races, Average-of-the-Last-3-Races, Best Ever, etc.
It is safe to assume that to a large degree, these two tables illustrate just how dialed in the public is to the impact of speed ratings.
Look at the gigantic shift in efficiency in the ratio!
Understand that the normal annual shift (in major factors like these) has been something in the vicinity of 2-3%. That's kind of like saying, "The public is getting 2-3% smarter every year."
This particular jump was in the magnitude of 10%!
This is unprecedented. I check these figures almost every year and have never seen a jump like this.
By comparison, Quirin Early Speed Points have been tuned in for so long that they hardly change at all.
(As a side note, a logical question for a handicapper to ask themselves is, "What did I do this year to get 3% smarter?")
Let's do another.

Here's an older version of HDW's Projected Speed Rating. It has been around much longer, does not correlate with the tote board as much as PSR (or BPP), and, like Q ES Pts, has been dialed in for several years.
Still, it moved downward over 3%. (129-125) / 125 =3.1%.
I contend that there is a silver lining to this. I believe the whales have created a vulnerability and I will share it with you.
Next, we look at the impact on the tote board.
The odds change in the opposite way.
What we see here is a widening of the top-to-bottom $Nets.
This is the impact of even more winners being pushed towards the top. Now, some of this is caused by smaller fields.
Look at the 2017 stats. See how the $net was relatively even between the first 3 choices ($1.68, $1.66, $1.64), then dropped off at "FH" ($1.49)?
A summary of 2017 would be:
1st, 2nd, 3rd = best
FH = bad
RH = horrible
Now look at 2018. Thus far this year, we've seen the actual favorite rise a couple of cents, over the next two ranks.
A summary of 2018 would be:
1st = best
2nd, 3rd, FH = good
RH = horrible
In other words, favorites are returning more money at a slight expense to the 2nd and 3rd choices, while the FH has improved to become equal with 2nd/3rd. The RH has gotten even worse.
To say this in fewer words, the public is more dialed in on everything above the rear half. (This is shown clearly in the $Net ratio change.)
Another thing to say would be that some of the winning longshots of the rear half are being bet down so that they pay less.
Finally, there is this...

This is the summary table. I ran it against these key factors but usually run it against about 200 factors.
There are 4 metrics:
$Net Ratio
IV Ratio (Impact Value)
PIV Ratio (Pool Impact Value)
PubCh Ratio
Remember that these ratios are always rank1 divided by RH to produce a ratio except for PubCh which is the other way around. That is, it is the average public choice rank of RH divided by average public choice rank of the favorite.
That last one can be confusing. Essentially, the 1st 3 of these ratings are beneficial to the handicapper if the winners are pushed to the top. (i.e. better ranks mean more money returned.)
However, the public choice thing means we'd rather see the RH horses be HIGHER ranks for public choice.
The scoring column is merely all the ratios multiplied together.
The key point here is that the PubCh factor - that is, rank for lowest odds - has moved from rank of 5th to rank of 2nd in one year.
This is absolutely unprecedented.
What does it mean?
It means that the days of just picking longshots with no regards for how strong the low-odds horses are or aren't and being competitive are pretty much over.
It means that if you are going into a race with an idea that sounds even remotely like, "I just pretend that all the horses under 8/1 are not in the race," you are done before you get started, because the low odds horses are going to pound you.
Permit me to give you some sobering stats:
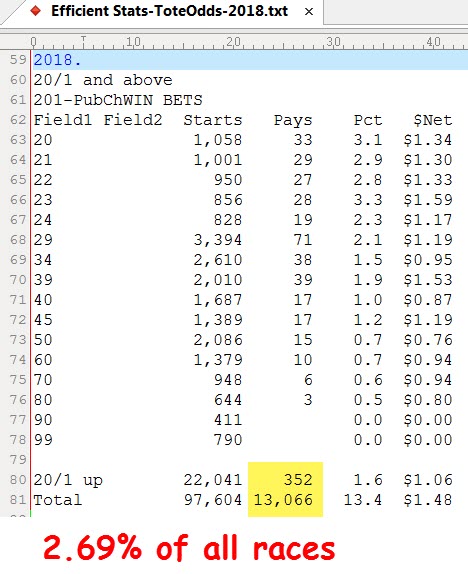
Do you want to connect on 20/1 horses? They come up 2.69% of the time. That is once every 37 races.

What's that you say? You only play 8-horse fields and above?
Well, that will add a couple of points to your chances. You're now all the way up to 4.36%.
One of those occurs every 23 races. Hope you have the right horse in that race.
Let's be more realistic. (And back to all races again.)
86% of all winners are under 8/1.
79% of all winners are under 6/1.
70% of all winners are under 9/2.
61% of all winners are under 7/2.
What about 8+ horse fields?
81% of all winners are under 8/1.
73% of all winners are under 6/1.
63% of all winners are under 9/2.
53% of all winners are under 7/2.
So, with all this bad news, where is the good news?
That's coming as soon as I can get it written, which could take me a couple of hours.
Meanwhile, what do YOU think a GOOD answer could be?
This year's retooling effort seems to have changed things quite a bit from my POV.
Remember that when the whales agree on who should be bet, they all lose. To be clear about that, when a track has a big day for favorites, all the whales lose money because they're betting more than just those winning favs.
IMHO, because there are so many winners who are showing up as bet downs after the gate opens, the handicapper who EXPECTS to be competitive, needs to address these issues:
1. Which horse(s) are likely to be bet down below what they should be?
2. Which, of the low-odds horses is a true bet against horse?
This may seem like handicapping 101 but it is actually far different than what most players do now.
As I said in one of my earlier posts, the days of just ignoring the favorites (i.e. assuming that all favorites are bad bets) and focusing on the long shots is a definite path to the poor house.
If one considers implementing those two steps I have recommended, one will find that there must be a serious change in their handicapping technique.
Notice that there is no mention of actually handicapping the race from a conventional POV.
It is all about those two steps.
Example: If you look at class drops, which of those two issues does it address? Will it point to a horse that will be bet down after the gate opens? Does it point to a low-odds BIG loser (in terms of money returned)?
If it does neither of those, it serves no purpose but to obfuscate the goal.
I've not had a winning year thus far. Since I began working on this approach, based upon extensive paper play, I've become convinced that the approach is sound.
Ironically, my average prices have never been this high because a substantial number of "bet downs" are in the $9 to $18 range, with the occasional monster hit.
As I said, all this is on paper, so I still have to see how it plays out when pulling the trigger live. I don't expect it to be any different because the system is 100% automatic and there is zero use of the tote board.
Another piece of irony is that when I have introduced the actual odds (which, of course, I would never have when playing live) my results were NOT AS GOOD!
I've shared this because I know that there have to be some pretty good handicappers out there that are having a more difficult time than usual this year. Perhaps this will offer you some potential places to look for answers.
So, in my opinion, this is a new way to play.
As for how you actually do this, I will not share that. There is no new product coming, no new videos or book on this topic.
Good luck to all of you.

Watch All the 'Talking Handicapping' Videos
If you haven't watched the Getting Started video, you can find it here
See Dave Schwartz's Bio
Check back often. Did you know that the best stuff goes directly to our email community? Be the first to hear about special offers, new products, and new material. Sign Up Today.
Why you should join Dave's Private Facebook group:

- Would you like access to the SPECIAL videos?
- Are there things you need to know?
- For the first time you will have a place to ask questions.
- All this is absolutely FREE.